This is the ninth article of a 10 part series on redistricting + apportionment + gerrymandering, in relation to Alabama.

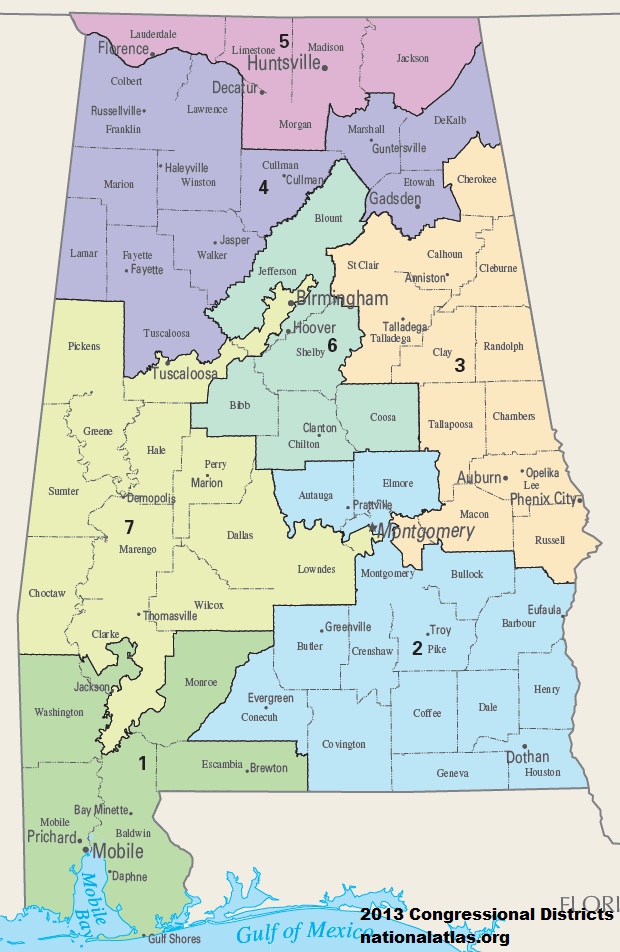
Now we’re going to examine the state of Alabama and how things stand with our current Congressional districts. Further along in the post we’ll zoom in and examine the situation in Tuscaloosa County that has been divided between two different Congressional districts as you can see on the map (the 4th and the 7th).
In the previous blog post (# 8), “geographic contiguity” was listed among the League standards. Our League member Robin Buckelew has done extensive analysis of some local situations that we will draw on here in examining the Congressional districts on the map above. The practical effect of the contiguity constraint in Alabama is that in areas of highly concentrated Democratic voters, like the Black Belt, there are districts packed with Democrats. It is not possible to crack up these areas and assign them to safe Republican districts (it would also violate the prohibition against racial gerrymandering, as these areas have a large African-American population). In urban areas, such as western Madison and eastern Limestone counties, it is easier to crack an area demographically Democratic and assign pieces of it to surrounding Republican areas so that most districts end up reliably Republican.
Alabama chooses to use a very tight equal population constraint (± 1%) in order to justify non-compactness and breaking up geographical and political communities of interest. On the map above, note the 2nd, 6th, and 7th districts, and especially how the 7th snakes through Birmingham. The 7th district is the only one in Alabama represented by a Democrat (Terri Sewell), and she was unopposed in the last election. Looking at the vote tallies for US President in the last three elections (70%-72% Democrat), the district is packed overwhelmingly with Democrats. It is surrounded by safely Republican districts.
League members and other interested citizens, with access to the various software packages (see part eight for explanation), should be able to create alternative maps with the new Census data coming out on August 16th and in September (see this video for more details), maps that come closer to providing fair representation. . We discussed the fairness issue in part four: “In 2018, 43% (about 3 in 7) of Alabamians voted to have a Democratic representative in Congress. A little less than 4 in 7 (55%) voted for a Republican Congressperson. From this perspective, Alabama doesn’t seem as partisan (or dominated by one party) as we are often led to believe. If we just think about the numbers in terms of voter preferences, if we have 7 Congressional districts, then 3 of them should have sent a Democrat to Congress, and 4 of them should have sent a Republican. But what do we actually have? Only 1 in 7 (14%) was won by a Democrat.”
Considering now the 4th and 7th Congressional districts that each include part of Tuscaloosa County, the 7th is overwhelmingly Democratic, and no Republican has run for that seat in the last three elections. Tuscaloosa County as a whole has a Republican voting majority, although not an overwhelming one. In fact, in the 2018 midterm election, Walt Maddox (a Democrat serving as mayor of Tuscaloosa) actually won the county over Kay Ivey (a Republican serving as governor) by only one vote. Maddox received 34,336 votes, and Ivey received 34,335. The vote tally for Lieutenant Governor was Ainsworth (R) 37,639 versus 30,507 for Boyd (D). These numbers suggest that not only does Tuscaloosa have a large contingent of Democratic voters, but that it also has a large number of Republicans who are willing to vote for the person rather than the party.

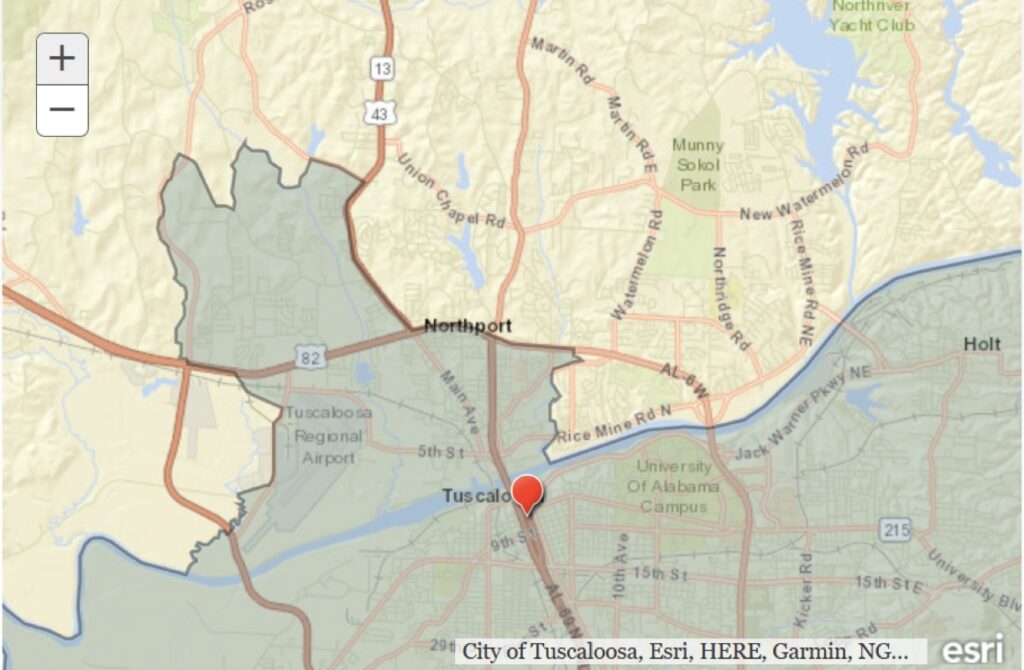
On the map above, the 4th Congressional district is to the north, and a yellowish color; the 7th district is to the south, and a grayish color. If you look at the district line on the map as it cuts through Tuscaloosa, you can see that it is very irregular. From following the Black Warrior River, it suddenly breaks north and covers some odd-shaped plots in Northport, and the Tuscaloosa airport, before coming back down to the river. In the next map we get an idea why this happens.

Now we are going to take a closer look at the area on the first map above as a case study in how the lines can be manipulated to pack Democrats into a single district and minimize the number of Democrats voting in other Congressional races. We realize that this is getting complicated, but please try to bear with us because what you’re seeing is how gerrymandering is accomplished at a granular level.
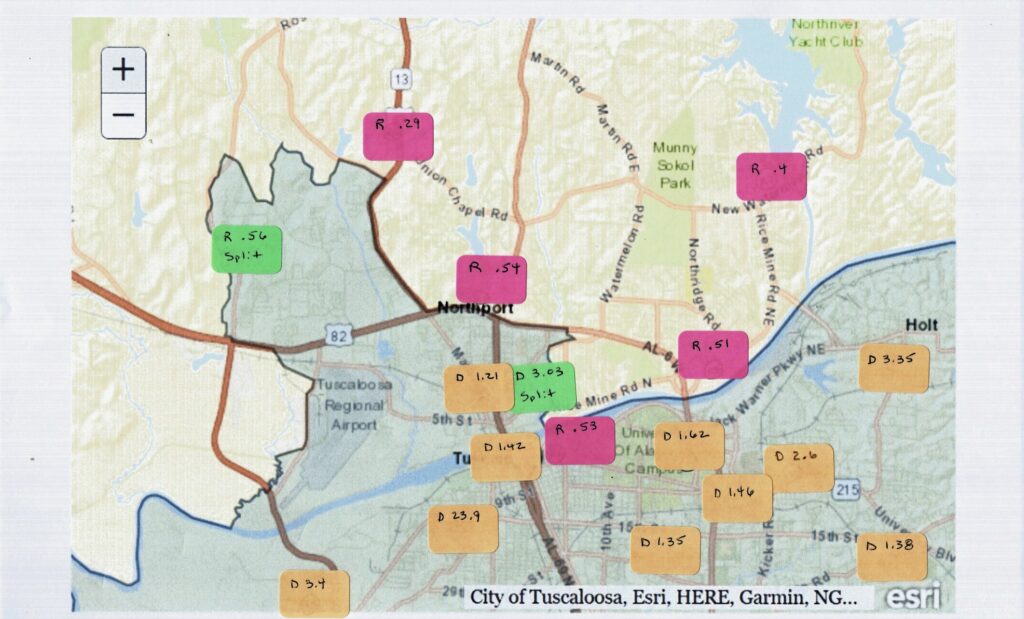
If you look at the image above showing part of a map of Tuscaloosa, you can see a line that traces the very irregular district boundary between District 4 (the yellowish area to the north) and District 7 (the grayish area mostly to the south of the river). Stickers on the map denote the polling locations for precincts. The data used were the voting totals for the Lieutenant Governor’s race to label a precinct Republican or Democratic. The precincts included on the map are those that are relatively close to the district line and thus relevant for gerrymandering manipulation.
The green stickers represent split precincts, in which some of the voters vote in Congressional District 7 (currently held by our only Democrat in the U.S. House), and some in District 4 (currently held by a Republican in the U.S. House). The orange stickers represent precincts wholly contained in District 7. The pink stickers represent precincts only voting in District 4. The precinct party majorities are noted on the stickers. The larger the number (if greater than one) by the party affiliation, the larger the Democratic majority. A number less than one indicates a Republican leaning precinct.
Tuscaloosa County had 54 voting precincts during the 2018 election. Of those, 16 voted majority Democratic. Fifteen of those 16 were included entirely within the 7th district, and one was split. Notice how carefully the line threads between Democratic majority precincts and others. This effectively removed a huge chunk of Democratic voters from District 4. The bottom line is that Terri Sewell received 27,540 Tuscaloosa County votes in the 2018 election, out of the 185,010 votes she received overall. Tuscaloosa County gave 4th District candidates Auman (D) and Aderholt (R) 5,456 and 17,539 respectively. The 27,540 Sewell votes were part of a strategy to minimize Democratic votes in districts outside of District 7, and prevent a Democratic candidate from winning in District 4 (or any other district in Alabama). What you see here is part of a masterful job of “packing” as many Democratic votes as possible into one Congressional district.”
We hope that you now have a better idea of how the unfair practice of partisan gerrymandering in the redistricting process can work, and why the League is highly engaged on this issue. If you’re computationally-minded and feeling inspired to learn more, again we refer you back to post eight on mapping software packages.
This series is a joint effort of the blog editor, Catherine Davies, and other members of the Advocacy Team and Board of the League of Women Voters of Alabama.

